
Free Growth Curve of Microorganisms OCR A Level Biology revision notes – covering specification point 6.2.1(hi).
A standard growth curve describes the distinct changes in population growth which a population of microorganisms goes through in a closed culture.
Population growth occurs over four distinct growth phases known as the lag phase, log phase, stationary phase, and death phase:
- Lag phase is when the inoculated microorganisms adjust to their new environment, taking up nutrients and synthesising proteins (e.g. enzymes). Population growth is slow.
- Log (exponential) phase is when the microorganisms rapidly divide in large amounts of space and available nutrients. Population growth is exponential.
- Stationary phase is when available nutrients are low, space is limited, and metabolic wastes accumulate. Population growth stays constant.
- Death (decline) phase is when nutrients run out, and the concentration of metabolic waste products becomes lethal. The population declines.
The graph below shows the standard growth curve of a population of microorganisms in a closed culture:
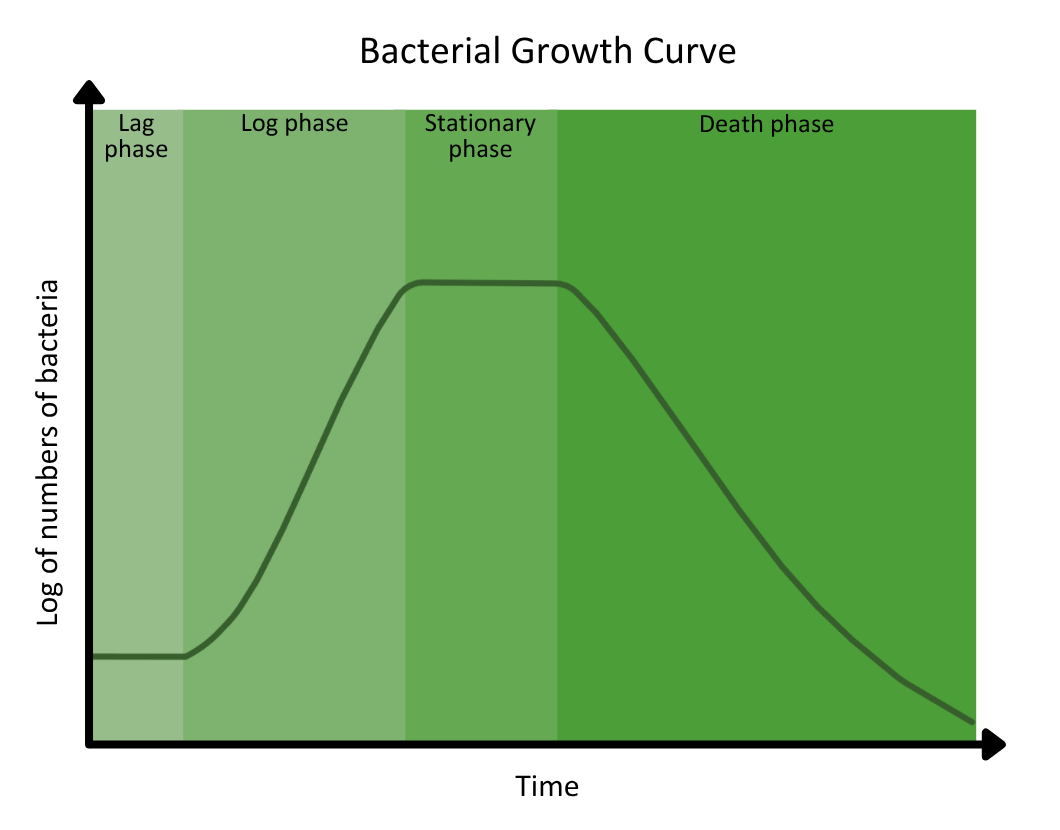
Population growth in microorganisms is typically exponential during the log phase of a growth curve.
The number of microorganisms in a population undergoing exponential growth can be calculated using the formula:
N = N₀ × 2ⁿ
Where:
- N = the final number of microorganisms.
- N₀ = the initial number of microorganisms.
- n = the number of generations that have taken place.
- 2ⁿ = the doubling of the population after each generation.
The number of divisions is calculated using the formula:
n = total time ÷ mean generation time
Serial Dilutions
A serial dilution is a stepwise sequence of dilutions that lowers the concentration by the same factor (e.g. 10).
For example, adding 1 cm³ of a solution to 9 cm³ of water dilutes it by a factor of 10*.
*Sometimes described as tenfold.
Serial dilution reduces the concentration of microorganisms enough so that the colonies they give rise to are unlikely to overlap and can be clearly counted.