Module 3: Haemoglobin and Red Blood Cells
These free OCR A Level Biology Haemoglobin and Red Blood Cells revision notes have been written for specification points 3.1.2(i) and 3.1.2(j).
Red Blood Cells
Erythrocytes are specialised cells adapted for the transport of oxygen in the blood by using haemoglobin.
The table below outlines the structural adaptations of RBCs:
| Structure | Function |
|---|---|
| No nucleus or organelles | Maximises space for haemoglobin (Hb), allowing more oxygen to be carried. |
| Biconcave shape | Increases the surface area to volume ratio, speeding up the diffusion of oxygen and carbon dioxide. |
| Flexible membrane | Enables cells to squeeze through narrow capillaries without them rupturing. |
| Thin cell | Short diffusion distance between plasma and haemoglobin. |
Oxygen transport and haemoglobin
RBCs are packed with haemoglobin, and each one can bind reversibly with up to four oxygen molecules, forming oxyhaemoglobin (HbO₂).
Haemoglobin + O → Oxyhaemoglobin
Oxygen affinity
Whether or not oxygen will bind to haemoglobin depends on the haemoglobin’s affinity for oxygen.
The table below outlines the different factors that can affect haemoglobin’s affinity for oxygen:
| Factor | Effect on Affinity | Explanation |
|---|---|---|
| Cooperative binding | Varies | The number of pre-existing oxygen atoms bound to haemoglobin can make it easier or harder for subsequent oxygen atoms to bind. |
| Partial pressure of CO2 (pCO2) | Decreases with higher pCO2 (Bohr shift) | CO2 lowers pH, causing haemoglobin to release oxygen more readily. |
| pH (H+ concentration) | Decreases with lower pH | H+ ions bind to haemoglobin, changing its shape and reducing oxygen affinity. |
Cooperative Binding
Cooperative binding is the phenomenon by which the first oxygen atom binding to haemoglobin makes it easier for subsequent oxygen atoms to also bind.
This is reflected in the sigmoid curve of an oxygen dissociation curve showing haemoglobin’s saturation.
Haemoglobin’s hold on oxygen varies at different pO₂ levels because its shape changes due to carbon dioxide dissolved in the surrounding tissue fluid – the acidity affects its tertiary structure.
The graph below compares how easily different haemoglobins bind to oxygen, including normal human haemoglobin, a higher-affinity form (like fetal haemoglobin), and a lower-affinity form (such as in active tissues):
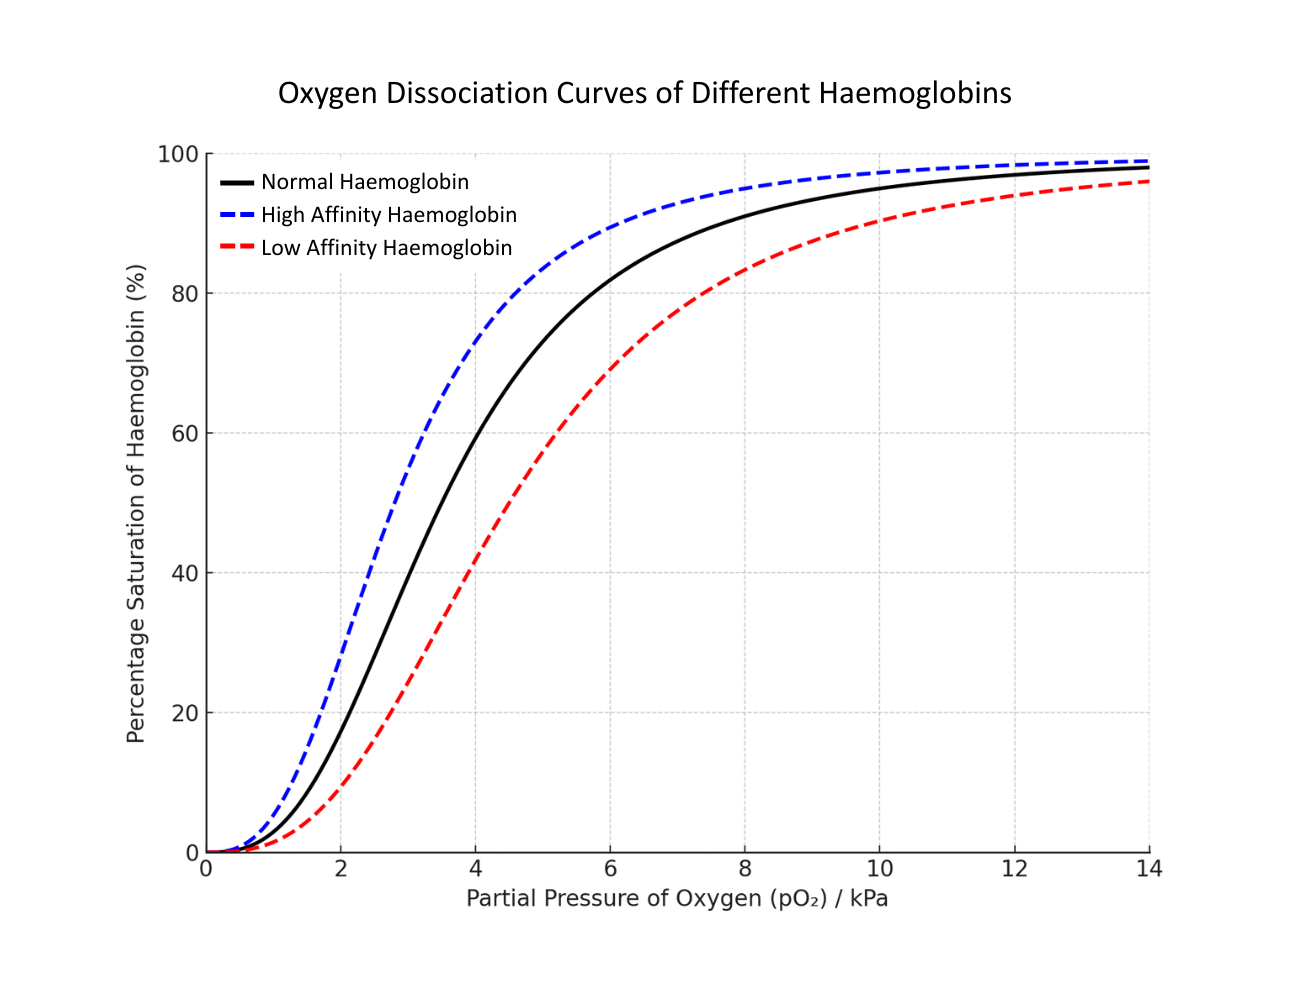
The black line is typical human haemoglobin, the blue line is haemoglobin which more readily binds with oxygen (it has a higher affinity), and the red line is haemoglobin which less readily binds with oxygen (it has a lower affinity).
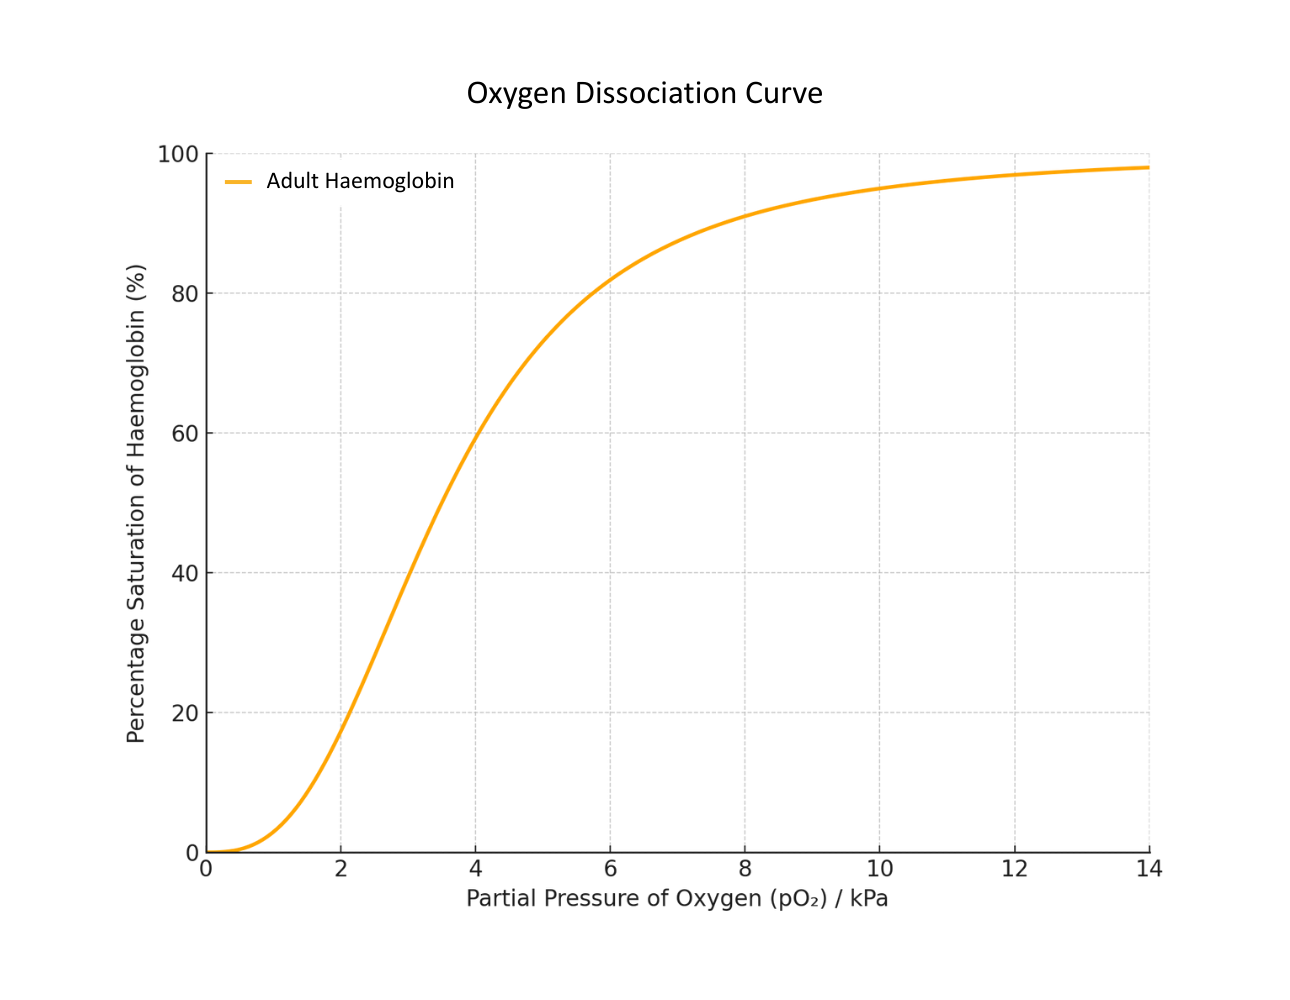
Interpreting a standard (Adult) Oxygen Dissociation Curve:
- The curve is sigmoidal (S-shaped) due to cooperative binding: as one molecule of oxygen binds to haemoglobin, the molecule’s affinity for oxygen increases.
- At high pO₂ (e.g. in the lungs), haemoglobin becomes highly saturated with oxygen.
- At low pO₂ (e.g. in respiring tissues), haemoglobin releases oxygen, aiding diffusion into cells.
Comparing Adult and Fetal Haemoglobin
The placenta has a relatively low pO₂, causing maternal haemoglobin to release oxygen, which can then be taken up by fetal haemoglobin (which has a higher affinity for oxygen at the same pO₂).
The fetal haemoglobin curve is shifted to the left of the adult haemoglobin curve at the same pO₂:
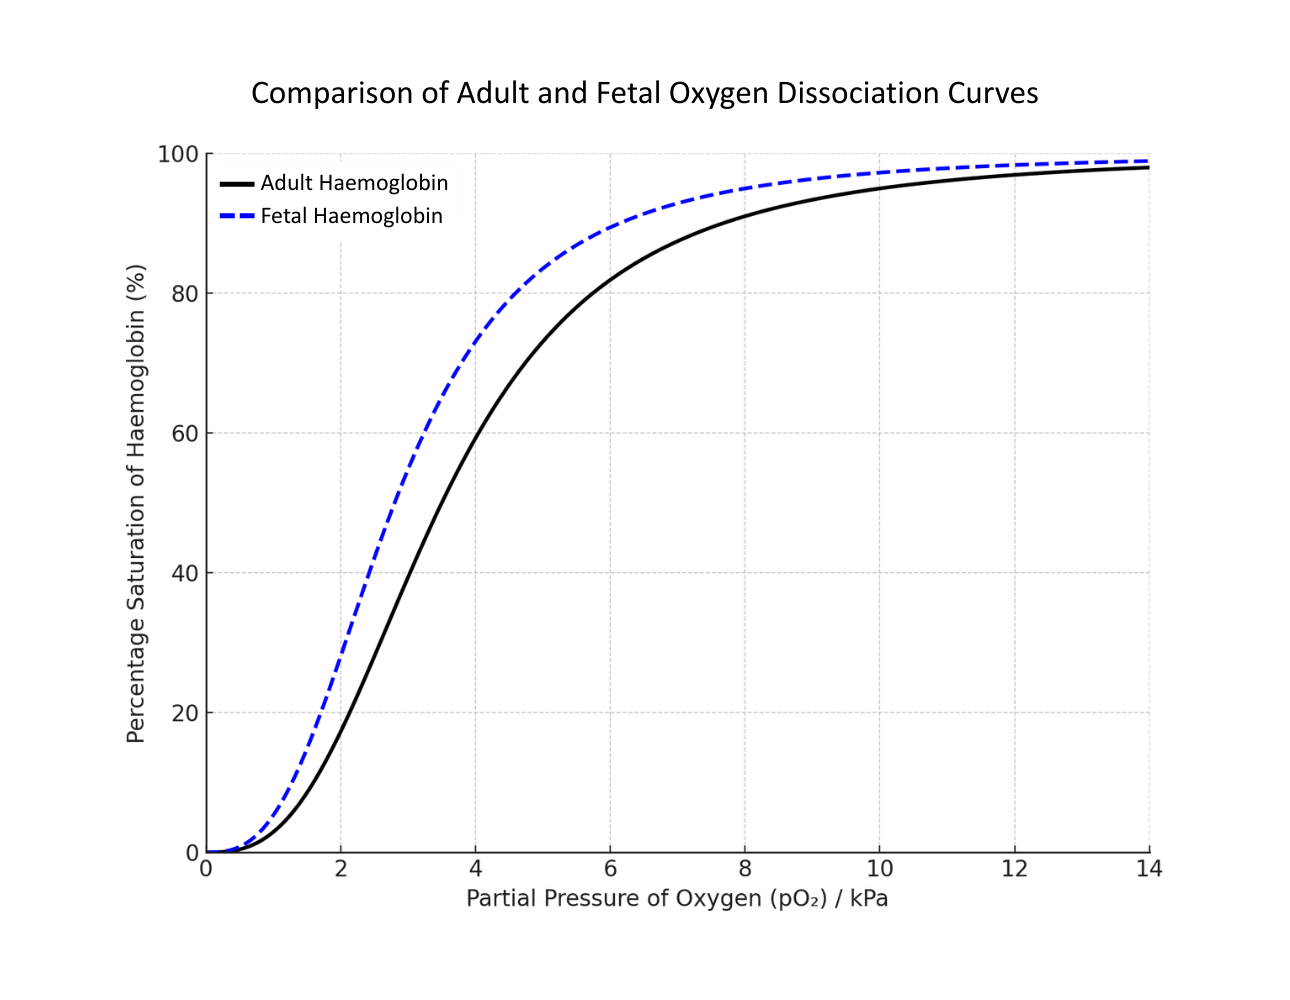
Fetal haemoglobin is more saturated at the same pO₂ compared to adult haemoglobin, meaning it will load oxygen in conditions where adult Hb would release it; facilitating the transfer of oxygen from maternal blood to fetal blood at the placenta.
Bohr shift
Bohr shift (also known as the Bohr effect) is where increasing CO₂ concentrations in the blood plasma lower haemoglobin’s affinity for oxygen.
This is because CO₂ dissolves in blood plasma to form carbonic acid, lowering its pH and changing haemoglobin’s conformational shape.
The result of a Bohr shift is to promote oxygen unloading in actively respiring tissues.
The graph below shows the effect of different concentrations of CO₂ on a standard dissociation curve:
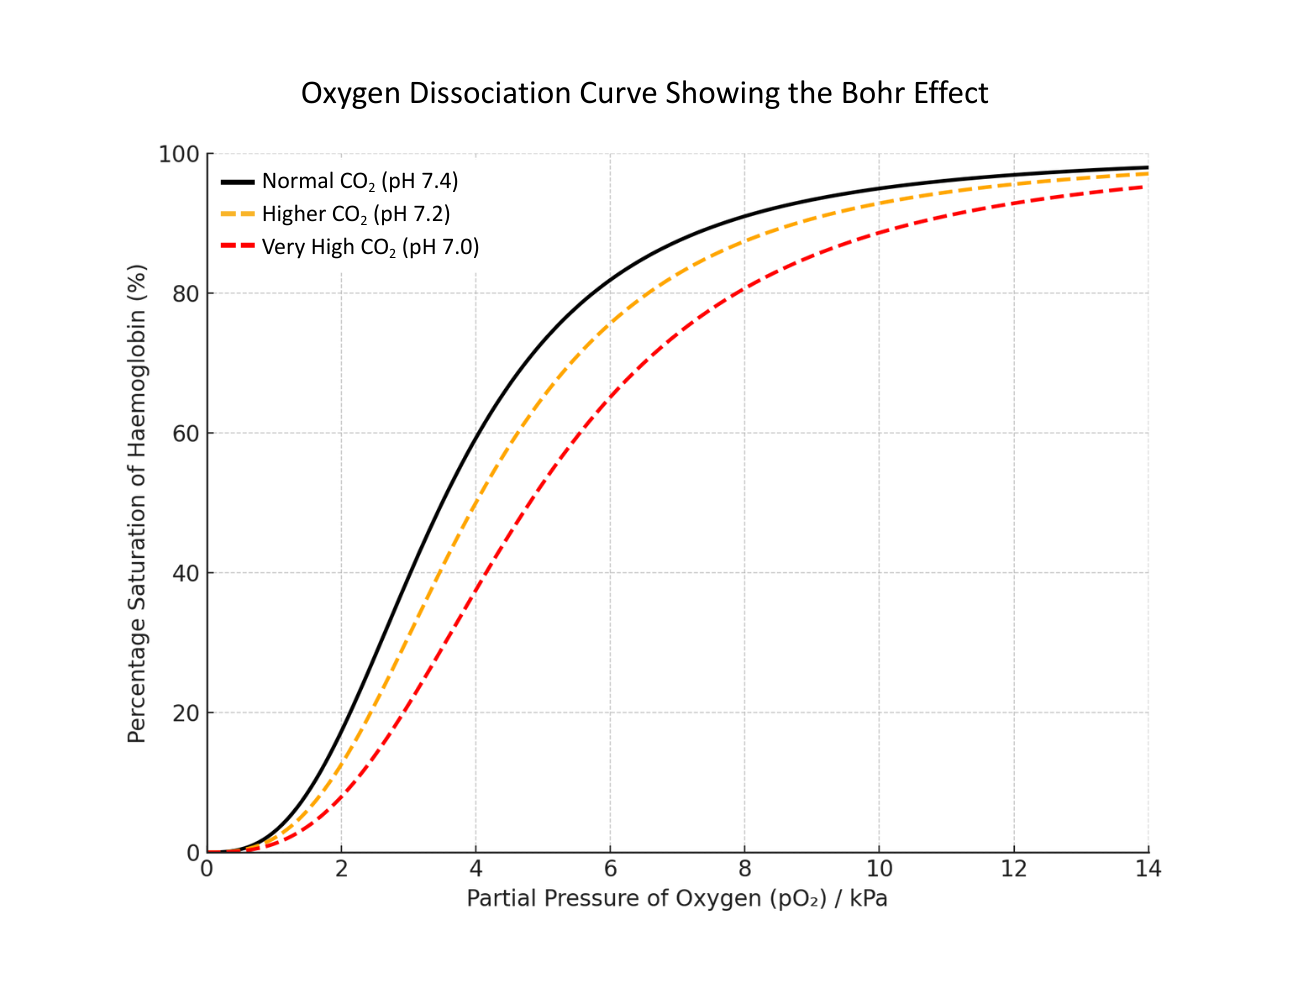
If there is more carbon dioxide, then the pH drops, so haemoglobin is (on average) less saturated (as it is releasing oxygen more readily due to a lower affinity). The curve shifts to the right. This is the Bohr effect.
Carbon Dioxide Transport
CO₂ diffuses into red blood cells (RBCs) and reacts with water, catalysed by carbonic anhydrase:
CO₂ + H₂O ⟶ H₂CO₃ ⟶ H⁺ + HCO₃⁻
The hydrogencarbonate ions (HCO₃⁻) diffuse out of the RBC into the plasma.
Chloride ions (Cl⁻) move into the RBC from the plasma, balancing out the electronegativity of the departing HCO₃⁻; this is called the chloride shift.